Waste Data From Largest Global Waste Study Reveals Almost 2/3 of What Businesses Are Throwing Out Is NOT “TRASH”
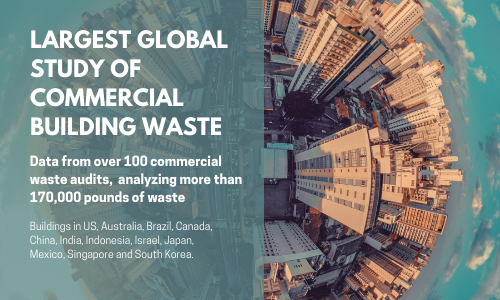
In 2022, Great Forest completed the largest and most comprehensive waste characterization study to date focused on commercial buildings. That study has now been peer-reviewed and published in The Journal of Solid Waste Technology and Management. The wide-ranging study utilizes waste data collected through waste audits conducted by Great Forest in 2019 at over 100 buildings across the US and internationally, analyzing over 170,000 pounds of waste.
The waste data collected through the study delivers one of the most in-depth waste profiles ever created of a typical commercial building, providing insight into the amount and types of waste generated by buildings globally. The findings reveal some surprising similarities across buildings, and also identify big missed opportunities that buildings everywhere should address to make a big impact on waste and cost reduction.
How does your building or business facility compare?
Read a snapshot summary of our waste data findings below, or read the full paper published in the May 2022 issue of The Journal of Solid Waste Technology and Management.
Study Scope: Waste Data From 100+ Waste Audits At Buildings Worldwide
The waste characterization study utilizes waste data collected from 114 waste audits at buildings located in the New York, New Jersey and Connecticut tri-state region, the Mid-Atlantic region and Northern California. Other audits took place both within the contiguous U.S. and in the following countries: Australia, Brazil, Canada, China, India, Indonesia, Israel, Japan, Mexico, Singapore and South Korea.
Waste Data Covers 100% Review of Commercial Buildings
Prior waste characterization studies covered mostly residential or a combination of residential and commercial buildings for municipalities using random sampling. The Great Forest study focuses on commercial building and includes a review of 100% of the daily waste stream from the individual buildings audited, providing an illustration of waste data characteristics at the building level that was not available before.
Waste Characterization Study Methodology
Great Forest collects waste data from over 100 waste audits every year. The methodology used has been developed over 30 years of experience.
Audits for this waste characterization study were comprehensive, with each waste stream broken down by its material components, sorted into 20 categories, and weighed separately. The process included weighing, categorizing and recording every bag of waste from each building, and then opening each bag and sorting its contents. All recyclable items (except electronics ) were then further separated into “clean” and “soiled” categories (identifying recyclables soiled by food waste or other contaminants is important as those are not accepted by recycling facilities.)
WASTE STUDY: SUMMARY OF WASTE DATA

Trash is the LARGEST waste stream:
The waste characterization study found that of all the waste streams (which might include Paper Recycling Stream, Cardboard Recycling Stream, Glass/Metal/Plastic Recycling Stream, and Diverted Organics Stream), the Trash Stream was on average the largest portion of a building’s waste stream.
In other words, the majority of an average building’s waste wound up in the trash rather than recycling or compostable organics streams, even if the materials were recyclable or compostable.
62 percent of “Trash” is NOT trash at all:
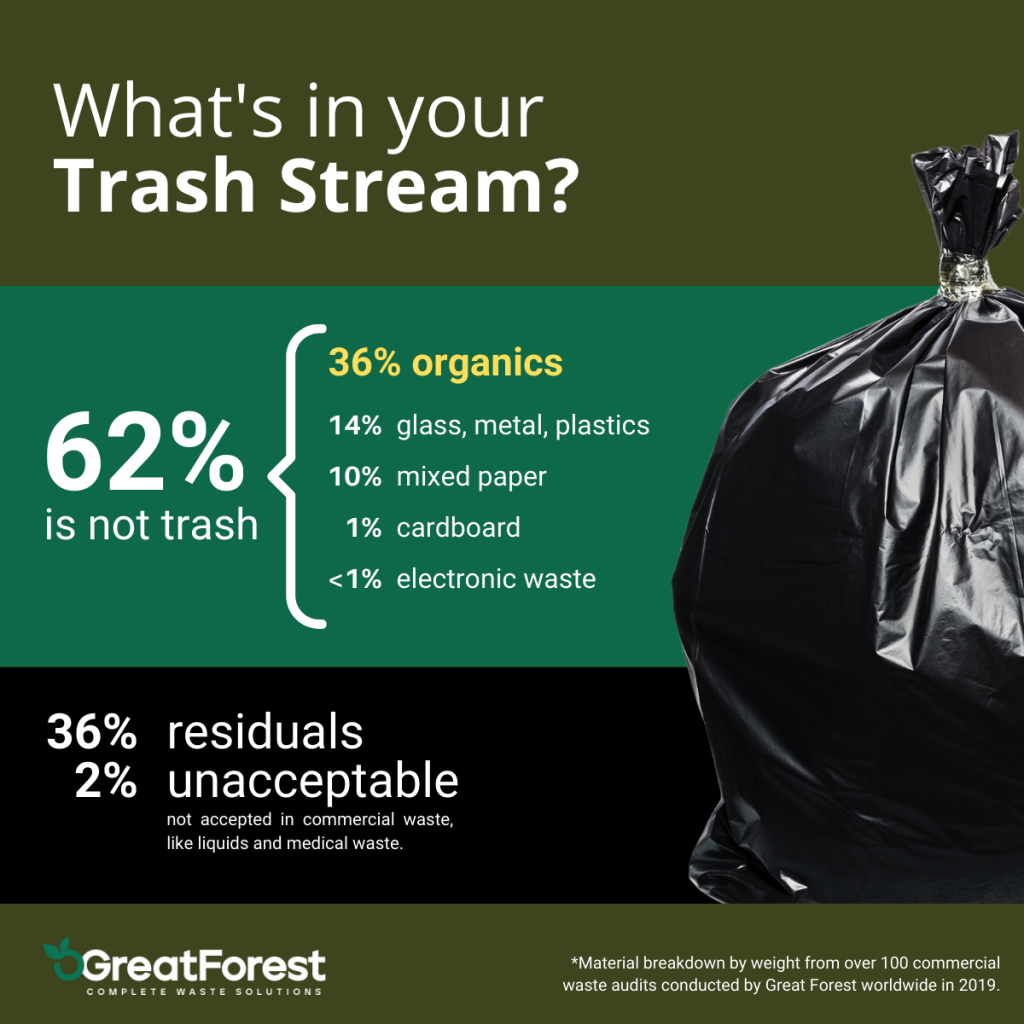
Currently, most buildings are paying to send more materials to the landfill than they need to. The waste characterization study found that a staggering 62 percent of material found in a building’s Trash Stream is not trash at all, but is made up of materials that could be diverted. This includes:
- 36% organics
- 14% Glass/Metal/Plastic
- 10% Paper
- 1% cardboard
- < 1% electronic waste
The remaining 38 percent consist of what the industry calls “residuals” — materials that cannot be recycled, composted, or otherwise diverted using conventional waste management infrastructure.
Organics is the biggest missed opportunity:
The waste characterization study found that organic material — at 36% — consistently made up the largest portion of divertable material found in a building’s Trash Stream. Given that recycling diversion programs are already in place, incremental improvements in recycling are not going to make as much of an impact on increasing diversion within a building as a potential organics program.
Plastic Problem:
The largest portion of the Glass/Metal/Plastic materials found in the audits was plastic. The highest portion of contamination in the Glass/Metal/Plastic Recycling Stream was due to soiled plastics. And, the highest portion of recyclables going into the Trash Stream was consistently plastic across all buildings.
Clean Cardboard and Organics:
All programs showed large levels of contamination in their recycling streams, with the exception of the Cardboard Recycling Stream and the Organics Recycling Stream.
Cardboard is King:
Cardboard was most consistently diverted across all sites. Its diversion was high across every program and every region. Only 2-9% of cardboard in the waste stream was lost to the Trash Stream.
Liquids and Electronic Waste:
These two material types show up consistently regardless of region or program.
Liquids increase the weight of, and take up space in a waste load, increasing load size and causing incrementally more fuel combustion for waste transport. Additionally liquid contaminates otherwise recyclable materials and prevents processing.
Electronic waste can be diverted separately via e-waste recycling and is often a local requirement. It can also cause problems for waste handlers if discarded with the mixed recycling stream. In particular, lithium-ion batteries, often found in devices such as smart phones, can cause fires at recycling plants.
WASTE CHARACTERIZATION STUDY: MAIN TAKEAWAYS
Address organics:
With organics making up more than 1/3 of a typical commercial building’s Trash Stream, it is clear that buildings that do not already have an organics program should explore ways to address food and yard waste for beneficial use.
Address plastics:
Buildings that want to reduce their waste should address the plastic problem both upstream (in purchasing, providing reusable alternatives to plastic items, etc.) and downstream (education about how to avoid contamination in plastic recycling, and how to recycle right.)
Reduce contamination:
Besides education, buildings can take additional steps to reduce contamination, with a focus on liquids. For example, they can ensure that sinks are near recycling bins so that liquid contents can be easily emptied out.
Conduct Waste Audits:
The Great Forest waste characterization study provides a good idea of what global commercial building waste trends look like. Buildings should conduct their own waste audits to get accurate, customized data that is building specific. This will help determine what part of the waste program is working effectively or not, and what needs to be done to tailor solutions that work for their building and budget.
WASTE CHARACTERIZATION STUDY CONCLUSION
With waste costs rising and waste reduction identified as central to a circular economy, businesses responding to climate change with ESG frameworks have to understand the waste they are generating. This waste characterization study provides baseline building data that every building/facility/business owner and manager should take note of as it reflects the general trend in building waste worldwide, and reveals where the opportunities are that can make an impact.
Learn more:
Visit our resources page to download more white papers, guides, tips and more.

